Signs You Have Been Scanning Too Much
I have no idea where it came from originally, but I ran across this list while I was cleaning my digital house the other day. It is pretty funny, but also frighteningly accurate…
– – – – – – – – – – – – – – – – – – – – – – – – – – – – – – – – – – – – – – – – – – – – – – – – – – – – – – – –
Signs You Have Been Scanning Too Much
10. You wake up to the repeated beeping of your alarm clock, assume it’s just the scanner and go back to sleep.
9. While pouring syrup on your Eggo waffles, you note that you missed a few voxels.
8. Your knowledge of brain anatomy exceeds your knowledge of geography. As in, “The transverse occipital sulcus intersects the intraparietal sulcus near the level of the parieto-occipital fissure” and “The Sahara is in Afghanistan, I think.”
7. You have developed a rapid ritual for checking your body for metal that resembles the macarena.
6. When you seen drawings of brains in the popular media, you instantly decide whether or not they are anatomically correct.
5. Friends wonder how you can run a four million dollar scanner and still fail to program a VCR.
4. You suffer frequent left/right confusion and find yourself saying things like, “Make a left turn at the lights… No, I meant a *radiological* left!”
3. At parties, you scope out people’s subject-worthiness: “It was great talking to you. Say, what are you doing Friday night? … Do you have any metal in your body?…”
2. Not only can you recognize the brains of your frequently-scanned co-workers, but also their teeth from the bite bar impressions.
1. When reminded of a special occasion, you remember it fondly because the scanner was free all day long and you collected lots of good data.
Quote of the Week – Feynman
“It doesn’t matter how beautiful your theory is, it doesn’t matter how smart you are. If it doesn’t agree with experiment, it’s wrong” – Richard Feynman
New Software: HRFun (OS X)
 I have been spending a fair amount of time learning the Objective-C programming language lately. While I spend most of my time in Matlab, I am thinking about writing some Mac OS X applications in the future. For those of you who are looking to do the same I can highly recommend the Aaron Hillegass book “Cocoa Programming for Mac OS X” as a good way to get started. I will go into the learning Objective-C in another post, but wanted to take a second to announce the first complete fruit of my learning labor: HRFun.
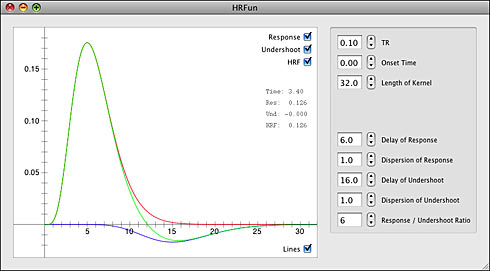
HRFun is a small Cocoa application that allows a user to explore the construction of a canonical hemodynamic response from the summation of two gamma functions. This is the method used by the Statistical Parametric Mapping (SPM) folks to model what happens in the brain when a stimulus is applied. For instance, if I show a brief flashing checkerboard pattern to a subject while conducting functional MRI then areas of visual cortex would have signal changes similar to the canonical HRF. I was curious about how varying the parameters of the gamma functions would change the predicted hemodynamic response, so I created this application that lets me vary any parameter I want.
It’s not a terribly useful app, but for those who are curious to learn more about the SPM construction of a canonical HRF it can be a useful tool. HRFun is my first OS X application to be released, so there are probably some inefficiencies and bugs in the code. Still, I have been diligent to test the software out and smooth the rough edges. Also, the source code has been released under the GPL. So, if you need an Objective-C class to create a hemodynamic response you’re in luck!
Let me know what you think – positive or negative. This is a learning project, so any feedback is appreciated. My next goal is to figure out how to load an fMRI timeseries – then the real fun begins.
HRFun wiki page: http://prefrontal.org/wiki/index.php/HRFun
Quote of the Week – Tukey
“The combination of some data and an aching desire for an answer does not ensure that a reasonable answer can be extracted from a given body of data.” – John W. Tukey, 1986
Brain Art: Axial Mosaic

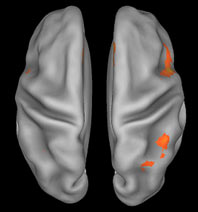
This is a piece we did as a cover illustration for the journal Human Brain Mapping. It depicts an axial slice of the brain composed of smaller images in the axial, sagittal, and coronal planes. To get the smaller images we used a simple Matlab script to go through each subject’s high-resolution 3D anatomical image and grab all possible 2D images in each plane. This resulted in 157 sagittal images, 189 coronal images, and 156 axial images for each subject. In total we ended up with about 10,000 smaller images to use. We then used the program MacOSaiX to take the thousands of small images and find the best fit for each hexagonal cell to represent the larger axial image. The blue and red coloring was added in Photoshop and represents the probabilistic values of white and gray matter in the current slice.
Click through to the larger image to really get a better feel for the photo. Cheers!
Prefrontal.org anniversary!
Truth be told we are a few weeks past the one year mark. Still, I couldn’t be happier about the degree of progress this blog has made in the last twelve months. What began as a simple motivation to practice writing has slowly evolved to become a more complete personal weblog of developmental cognitive neuroscience. In 12,000 words laid down across 50 posts there have been reviews of empirical articles, impressions of public presentations, software reviews, opinion pieces, and updates on the struggle to finish my PhD thesis. It is amazing to look back and see the greater whole that has formed one post at a time.
What is the goal for the second year? My primary goal is to post more often (2-3 times per week) and to aim for in-depth posts that take a bit more time to prepare. This will give the readers of this site additional material to peruse and gives me even more writing practice. The secondary goal is to continue filling in the quiet parts of the site, such as the ‘About’ and ‘Research’ pages. Who knows where this plan will take use 12 months from now, but if we can duplicate the success of the first year I will be more than happy.
Thanks for reading.
Quote of the Week – Fisher
“Modern statisticians are familiar with the notion that any finite body of data contains only a limited amount of information on any point under examination; that this limit is set by the nature of the data themselves, and cannot be increased by any amount of ingenuity expended in their statistical examination: that the statistician’s task, in fact, is limited to the extraction of the whole of the available information on any particular issue.” – R. A. Fisher
Summer Heatwave
Santa Barbara is an absolutely horrible place to be in the summertime. I mean, come on, 77 degrees? Who can stand that?

Principal Components of Individual Differences
I have been spending the last few weeks exploring principal components analysis (PCA) of functional imaging data. PCA has been around for over a century, having first been invented by Karl Pearson in 1901. I have always been taught that PCA was a powerful data reduction technique, allowing a handful of components to represent the variability of a far greater number of variables. However, my recent interest in PCA is from the perspective of exploratory data analysis, where PCA can be used to reveal the underlying structure of a dataset.
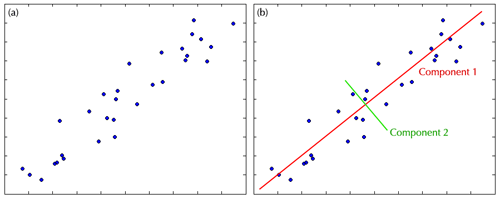
PCA is based on the idea that any group of variables will vary together to some degree. This covariance will be greater in variables that measure similar quantities. PCA capitalizes on the covariance of variables by using eigenvalue decomposition to extract components that can explain the greatest amount of variability in the data. A simple, two-dimensional example of this process is below.

The left figure above depicts the plot of two variables with high covariance. You can easily see that there is structure in the data, with levels of one variable highly related to levels of the other. PCA examines the cloud of data and asks, “along what dimension is the greatest amount of variability found?”. In the case of our plot, the greatest variability is found along the diagonal axis, which becomes the first component. After the variability of the first component is accounted for, a second orthogonal component will then be found. In this case the second component explains the spread of the data around the first component.
Combined the two components in the example explain 100% of the variability in the data. Still, they are not equal in their contribution. In this case the first component explains 97% of the variance, meaning that you could reduce your dataset by half using just the first component and you would lost only 3% of the variability.
We are trying to use PCA to examine individual differences between people in our fMRI study. By taking each person’s analysis results and running them through the PCA algorithm we are hoping to identify the underlying structure of variability between people. In conjunction with clustering algorithms, we can observe not only how people vary, but where in the brain the variability is strongest, and how people group together. Time will tell if this approach bears fruit, but it is a lot of fun to explore.
Cedrus Lumina Serial Emulator
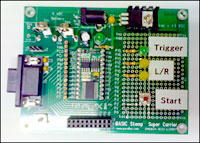
 The scanner at UCSB is always busy, leaving precious little time to get in and test your new experiment. You could stay late or come in during the weekend to get a turn on the magnet, or you can debug your experiment at your desk with a response emulator. This page on the prefrontal.org wiki has a set of instructions for creating your own emulator to provide a facsimile of the output provided by the Cedrus Lumina LP-400 box. It provides scanner trigger events every 2000ms with artificial subject responses following 250ms after each trigger.
I used this device extensively when I was programming some Psychtoolbox scripts. By getting all the big bugs out of your experiment before ‘going live’ and testing on a MR phantom you can save a lot of time, energy, and frustration.

