Principal Components of Individual Differences
I have been spending the last few weeks exploring principal components analysis (PCA) of functional imaging data. PCA has been around for over a century, having first been invented by Karl Pearson in 1901. I have always been taught that PCA was a powerful data reduction technique, allowing a handful of components to represent the variability of a far greater number of variables. However, my recent interest in PCA is from the perspective of exploratory data analysis, where PCA can be used to reveal the underlying structure of a dataset.
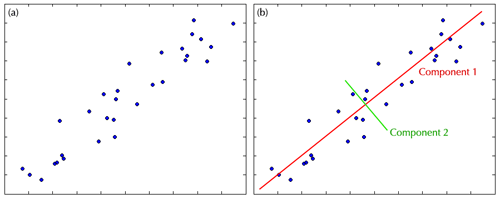
PCA is based on the idea that any group of variables will vary together to some degree. This covariance will be greater in variables that measure similar quantities. PCA capitalizes on the covariance of variables by using eigenvalue decomposition to extract components that can explain the greatest amount of variability in the data. A simple, two-dimensional example of this process is below.

The left figure above depicts the plot of two variables with high covariance. You can easily see that there is structure in the data, with levels of one variable highly related to levels of the other. PCA examines the cloud of data and asks, “along what dimension is the greatest amount of variability found?”. In the case of our plot, the greatest variability is found along the diagonal axis, which becomes the first component. After the variability of the first component is accounted for, a second orthogonal component will then be found. In this case the second component explains the spread of the data around the first component.
Combined the two components in the example explain 100% of the variability in the data. Still, they are not equal in their contribution. In this case the first component explains 97% of the variance, meaning that you could reduce your dataset by half using just the first component and you would lost only 3% of the variability.
We are trying to use PCA to examine individual differences between people in our fMRI study. By taking each person’s analysis results and running them through the PCA algorithm we are hoping to identify the underlying structure of variability between people. In conjunction with clustering algorithms, we can observe not only how people vary, but where in the brain the variability is strongest, and how people group together. Time will tell if this approach bears fruit, but it is a lot of fun to explore.

Leave a Reply
You must be logged in to post a comment.