Spring ’09 Conference Schedule
It is going to be a busy conference season this spring. I will be at the following professional gatherings over the next few months – send me an email if you will be attending as well and would like to meet up. I’ll buy the first round and we can talk shop.
Cognitive Neuroscience Society Conference [CNS]
March 21-24, San Francisco, California
New Horizons in Human Brain Imaging: A Focus on the Pacific Rim
April 13-15, Waikoloa, Hawaii
Organization for Human Brain Mapping Conference [HBM]
June 18-22, San Francisco, California
Conference on Neurocognitive Development
July 12-14, Berkeley, CA
Here are the titles of the posters I will be presenting:
[CNS]
• The impact of experimental design on the detection of individual variability in fMRI
Bennett CM, Guerin SA, Miller MB
[HBM]
• The processing of internally-generated interoceptive sensation (oral presentation)
Bennett CM, Baird AA
• Neural correlates of interspecies perspective taking in the post-mortem Atlantic Salmon: an argument for multiple comparisons correction
Bennett CM, Miller MB, Wolford GL
The ‘Voodoo Correlations’ saga continues
Saddle up cowpokes, and prepare yourselves, for yet another episode of Voodoo Correlations.
The latest salvo comes in the form of a reply authored by Lieberman, Berkman, and Wager. This is an invited paper that will appear in a future edition of Perspectives on Psychological Science alongside the original Vul, Harris, Winkielman, and Pashler paper.
You can download the new Lieberman, Berkman, and Wager reply here:
http://www.scn.ucla.edu/pdf/LiebermanBerkmanWager(invitedreply).pdf
The authors attack Vul et al. with a number of arguments, starting literally at the beginning with the title of their paper. As before, I think that there are a subset of points that should be regarded as ‘take home’:

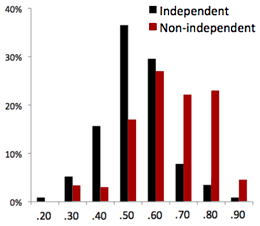
1. An examination of the mean correlation scores between Vul’s independent and non-independent groups shows that the difference between them is about 0.12. While the correlation scores of a non-independent analysis may be inflated, the degree of inflation is not as extreme as some have suggested.
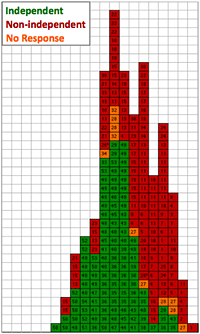
2. The Vul paper left out correlation data from their initial analysis that skewed their ‘non-independent’ distribution of values higher. Lieberman et al. argue that 54 additional correlations from the papers examined by Vul et al. should also be included. Most of these omitted values work against the findings of Vul’s analysis.
If correlation scores were selectively excluded by Vul et al. then the situation definitely needs some explanation. The very fact that Lieberman et al. found omitted correlation values in the papers examined by Vul et al. is somewhat suspect. I think there needs to be some more information released by Vul regarding how they selected the social neuroscience papers and what their criteria for inclusion was.
Lieberman’s argument regarding the actual degree of inflation in the non-independent correlation values is a strong one. Vul et al. argue that ‘a considerable number’ of the non-independent findings may be illusory, but one look at their original figure of independent and non-independent results shows that the distributions may simply have a small mean difference. This does impact the interpretation of the correlation magnitude, but speaks to the idea of valid results. This is an intuitive perspective that validates both Vul’s findings and the presence of honest effects in the social neuroscience literature.
None of the responses to date have discussed the fact that 44% of the authors who replied to Vul’s survey obtained their correlation value from a single peak voxel. So, within a cluster of 50 or 100 highly correlated voxels they chose to report only the one with the best correlation value in their results. This is capitalizing on chance and it still stands as a major issue. I do not believe that the practice is defensible.
My only wish in the Leiberman response is that they wouldn’t have introduced the ‘range correction’ in their new analysis of the independent and non-independent groups. I was really looking forward to a straight-up test of group differences with the excluded correlation values put back in. Instead, Lieberman et al. introduced the idea that certain correlation values of the independent group might have been underestimated because of the selection method. They then try to correct for this restriction, increasing the mean correlation of the independent group until it was not significantly different from the non-independent group. The problem is that now we cannot be sure what made the groups equal – the included correlations or the range correction.
Does anyone have a pool going with regard to when the next Voodoo Correlations response will be coming out? I’d like to put a few bucks on February 5th.
The “Ten Commandments of SEM”
Structural equation modeling (SEM) is a confirmatory method that allows researchers to test hypothesized relationships between variables and probe the ways that they influence each other. Rightly done it can be a very useful approach to have in your toolbox of methods. Still, true to most complicated techniques there are few ways to do it correctly and many, many more ways to screw it up.
On the rare occasion that I need to review a paper that uses structural equation modeling I always refer to the ‘ten commandments’, listed below (Thompson, 2000). They are a simple series of statements that can help steer researchers during the analysis and reporting phases of an experiment using SEM or similar analysis. If you are unfamiliar with SEM they might read like gibberish, but for those in the know they read like truth. Good stuff.
1. Do not conclude that a model is the only model to fit the data.
2. Test respecified models with split-halves data or new data.
3. Test multiple rival models.
4. Use a two-step approach of testing the measurement model first, then the structural model.
5. Evaluate models by theory as well as statistical fit.
6. Report multiple fit indices.
7. Show you meet the assumption of multivariate normality.
8. Seek parsimonious models.
9. Consider the level of measurement and distribution of variables in the model.
10. Do not use small samples.
* Thompson, B. (2000). Ten commandments of structural equation modeling. p261-284 in L. Grimm & P. Yarnell, eds. Reading and understanding more multivariate statistics. Washington, DC: American Psychological Association.
The ‘Voodoo Correlations’ debate heats up
It hasn’t taken long for the academically-heated exchanges to begin with regard to the recent Vul, Harris, Winkielman, and Pashler paper. You can’t call out such a large group of authors, say their results are practically meaningless, and not have some of them speak up.
One group of authors who were red-flagged as having non-independence errors have responded with a formal rebuttal. The Jabbi, Keysers, Singer, and Stephan PDF can be viewed at http://www.bcn-nic.nl/replyVul.pdf.
Ed Vul has already posted a response to this rebuttal. It can be viewed on his website at http://edvul.com/voodoorebuttal.php.
The author rebuttal does raise some good points, but to some degree it misses the point of Vul’s original paper. While a multiple comparisons correction does correct for the number of false positives that you will find in your data, it does not correct for the inflated correlation values that you will still find. Vul brings this up in his rebuttal, and in my mind it remains a key point.
The were several other arguments in the rebuttal that I just didn’t buy. For instance, the argument that social neuroscience is more concerned with where in the brain correlations occur and not necessarily with how strong the relationship is. While they gave a good example (I have read the Jabbi paper), it is not a good position to defend. I care about the strength of relationship, and I know a whole lot of other scientists who do as well. Are we wrong to want accurate correlation values?
The rebuttal also argued that the questionnaire used by Vul was incomplete and ambiguous. While this may or may not be true, it seems to be the case that the information was enough for Vul et al. to calculate their results. It will be interesting to see if any papers get taken off the ‘red list’ in the long run due to additional information being offered. This will be the true test of the survey.
Two points that I will add to the discussion:
1. I still can’t believe that so many people were reporting the correlation off of a single peak voxel. These authors were certainly capitalizing on chance when reporting their results, with or without the non-independence error.
2. I do not believe for a second that fMRI has a test-retest reliability of 0.98, not even on a good day. The rebuttal cites this number as justification for why correlation values could potentially be higher than Vul et al. suggest. I think that Vul’s original estimate of 0.70 may still be optimistic. For test-retest data from individuals my money would be somewhere in the 0.50 to 0.60 neighborhood.
Ed Vul has been keeping a very good collection of links and such on a webpage dedicated to the Voodoo Correlations paper. You can find it at http://edvul.com/voodoocorr.php. If interesting new arguments come up I may post again here as well.
As an aside, I can’t help but believe that this is going to be the direction of scientific discourse in the age of the Internet. Discussions and debates of hot topics are going to take place on a diverse collection of news sites, weblogs, and personal websites. Exchanges that used to take several publication cycles to occur will now happen in a matter of days or hours. It will likely be more confrontational in nature, but I do believe that it will be good for our scientific knowledge and scientific methods.
Voodoo Correlations in Social Neuroscience

The progress of science is not a continuous, linear process. Instead it moves forward in fits and starts, occasionally under protest. For a young field cognitive neuroscience has made dramatic advances in a relative short amount of time, but there have been some mistakes that we keep making again and again. Sometimes we get so set in our methods that it requires a major wake up call to get us off our asses. The recent paper by Vul, Harris, Winkielman, and Pashler (in press) represents just that: a call to action to change one particular old, bad habit.
Update: download the manuscript for free at:
http://edvul.com/pdf/Vul_etal_2008inpress.pdf.
The paper highlights an issue in the relation of neuroimaging data to measures of behavior often found in social and cognitive neuroscience. They found that some researchers do one correlation analysis against all the voxels in the brain (~160,000+) to find those that are related to their measure of behavior [sin #1]. They then report a second correlation, this time just between a selected set of voxels and their measure of behavior[sin #2]. These voxels are often selected on the basis of a strong correlation in the first analysis. This ‘non-independence error’ causes the second correlation estimate to be dramatically inflated, leading to results that may simply represent noisy data.
Sin #1 is a multiple comparisons problem. Vul et al. do not dwell on this error, but it is an issue that is pervasive in neuroimaging. The problem is this: when looking for a relationship between 160,000 voxels and ANYTHING you are likely to get a few significant results simply by random chance. Expanding on the example in the Vul et al. paper, I could correlate the daily temperature reading in Lawrence, Kansas with a set of fMRI data gathered in Santa Barbara, California and I would find a few significant voxels, guaranteed. Does this mean that the temperature in Kansas is related to brain activity? No, most certainly not. Most people try to account for this issue by having an arbitrarily high significance level and some form of minimum cluster volume. This constrains the results to those that are extra potent and have a certain minimum size. While it is a step in the right direction, this method remains a weak control for multiple comparisons. Instead, false discovery rate (FDR) and familywise error correction (FWE) are both excellent options for the correction of multiple comparisons. Still, many people ignore these methods in favor of uncontrolled statistics.
Sin #2 is the non-independence error. Bottom line: you cannot use the data to tell you where to look for results and then use the same data to calculate your results. That is exactly what many, sometimes very prominent, researchers did with their data. They did an initial correlation analysis to find what brain areas are interesting, and then took the data from those areas and did a second analysis to calculate final correlation value. Not surprisingly, the resulting values from this method were sky-high. This ‘non-independence error’ is the cardinal sin described by the Vul et al. paper. The error leads to values that are statistically impossible based on the reliability of behavioral measures and the reliability of fMRI. In arguing this fact Vul et al. has called into question the results from a number of papers in very prominent journals.
I have been reading many weblog articles responding to Vul et al. over the last week. Many of them were arrayed squarely against neuroimaging, citing the results as evidence that cognitive neuroscience is on a shaky foundation. This is certainly not the case. Functional neuroimaging is still our best option for non-invasively investigating brain function. I see this paper as the continued natural evolution of a still relatively young field. When we, as a field, first approached the question of relating brain function and behavior we all did our best to find a good solution to the problem. It turns out that for many researchers their initial solution was suboptimal and flawed. Vul et al. have pointed this out, as have many others. From this point forward it is going to be nearly impossible to make non-independence errors and get the results published. Thus, science has taken another step forward. A lot of toes got stepped on in the process, but it was something that had to happen sooner or later.
Now if we can just get people to correct for multiple comparisons we can call 2009 a success.
– Vul E, Harris C, Winkielman P, and Pashler H. (in press). Voodoo Correlations in Social Neuroscience. Perspectives in Psychological Science.
Voodoo Correlations Index
This post serves as an index of the articles that reference the ‘Voodoo Correlations in Social Neuroscience’ debate. The original paper has now been renamed ‘Puzzlingly high correlations in fMRI studies of emotion, personality, and social cognition’. There have been five posts so far, each listed below:
[1] Voodoo Correlations in Social Neuroscience:
http://prefrontal.org/blog/2009/01/voodoo-correlations-in-social-neuroscience/
[2] The ‘Voodoo Correlations’ debate heats up
http://prefrontal.org/blog/2009/01/the-voodoo-correlations-debate-heats-up/
[3] The ‘Voodoo Correlations’ saga continues
http://prefrontal.org/blog/2009/01/the-voodoo-correlations-saga-continues/
[4] The Dangers of Double Dipping (Voodoo IV)
http://prefrontal.org/blog/2009/04/the-dangers-of-double-dipping-voodoo-iv/
[5] Voodoo Perspectives on Psychological Science
http://prefrontal.org/blog/2009/06/voodoo-perspectives-on-psychological-science/
~Craig
The Presidential Election
Politics on a weblog is like picking up a stick of old, wet dynamite. You might grab it and absolutely nothing happens, or it might very well explode in your face. It is for this reason that I try to avoid political discussion on prefrontal.org. Every weblog must have a focus, and there are more than enough political blogs to go around. Still, I am compelled to write just one post after the recent presidential election. One post to say how much I have been desperately hoping for a new direction in our political system. One post to tell you how much of that hope I have invested in one man. One post to announce that I worked hard to help that man be successful. One post, to tell you that he was in fact successful.
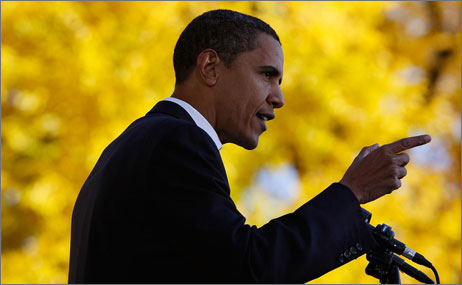
Congratulations, President-elect Barack Obama.
[Photo from Joe Raedle/Getty Images]
Quote of the Week – Gigerenzer
A former chairman of the Harvard Psychology department once asked me “Gerd, do you know why they love those pictures [the fMRI activity maps]?’ It is because they are like women: they are beautiful, they are expensive, and you don’t understand them” – Gerd Gigerenzer
Vandenberg Space Launch
 Now, let’s be clear, this is a weblog of developmental cognitive neuroscience. Still, those who know me understand that I began my undergraduate career in the aerospace engineering department. I have loved space flight since before I could ride a bicycle. I made a scrapbook when I was six years old that held every news clipping about the Space Shuttle Challenger tragedy – I still have it. Even now I love reading books on the Apollo moon landing program and Werner von Braun’s role in the early space program. Call it a hobby – it has always been a source of obsession. Still, in all my years I have never witnessed a live space launch.
Reason #318 why Santa Barbara is such an awesome place to live is the fact that we are 90 minutes away from Vandenberg Air Force Base. Vandenberg is a major spaceport in the United States for commercial and military space operations. They don’t always post their launch schedule, but enthusiasts from around the world pool their collective knowledge to assemble a rough idea of when rockets will be blasting off. In my case I had luck on my side, as a local television station was covering the countdown of a target launch vehicle from Vandenberg last Tuesday. I hopped up off the couch and got in the car.
The mission was related to the NFIRE (Near Field InfraRed Experiment) satellite, which was designed to gather data on the orbital observation of rocket exhaust plumes. To calibrate the sensors on the satellite they needed a, well, rocket exhaust plume. The target launch vehicle was a modified Minotaur ballistic missile, which was meant to simulate a ballistic missile launch for the NFIRE satellite.
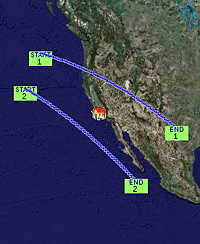
My wife and I headed up into the hills of Santa Barbara to see if we could witness the launch. Online Vandenberg observation FAQs indicated that it should definitely be visible. There was a two hour launch window that corresponded to two overhead passes of the NFIRE satellite (see above picture). We barely made it in time – as the satellite made its first pass, but we saw nothing but a few shooting stars. By looking at the orbital data for the NFIRE sat online (yea iPhone!) I knew the next satellite pass would begin at 11:57pm. Sure enough, at 11:58 we saw a bright orange light coming up from the horizon and blazing up into the night. Compared to your Fourth of July fireworks it wasn’t very special, but the knowledge that it was leaving the Earth’s atmosphere was about the coolest thing I have seen in a while.
Cheers to spaceflight everybody.
The Neuroscience of Running
Just over a year ago I began running as form of regular exercise. I was looking for an outdoor activity that I could do year-round in New Hampshire and found running to be enjoyable in both warm and cold weather. It took a few weeks to (literally) get up to speed, but I have been running an average of twice a week ever since. Over the last year I have begun to collect all of the fitness-related neuroscience articles that occasionally arrive at my inbox. I have been saving a few of them for a short review on the anniversary of my first run. That time has arrived, and so has the post – click to read more.
Read the rest of this post »

